

As we wait the release of the December quarter results for the US-centric Polen Focus Growth Fund (not currently available for Australian investors) in the period to 30 September 2021 the fund delivered returns approaching 16 per cent per annum (gross), outperforming the S&P 500 by 4.8 per cent per annum.
This extraordinary return has coincided with similar annualised Earnings Per Share (EPS) growth at the Portfolio level. Hence, there is a very high long-term correlation between the Fund performance and the Portfolio EPS growth.
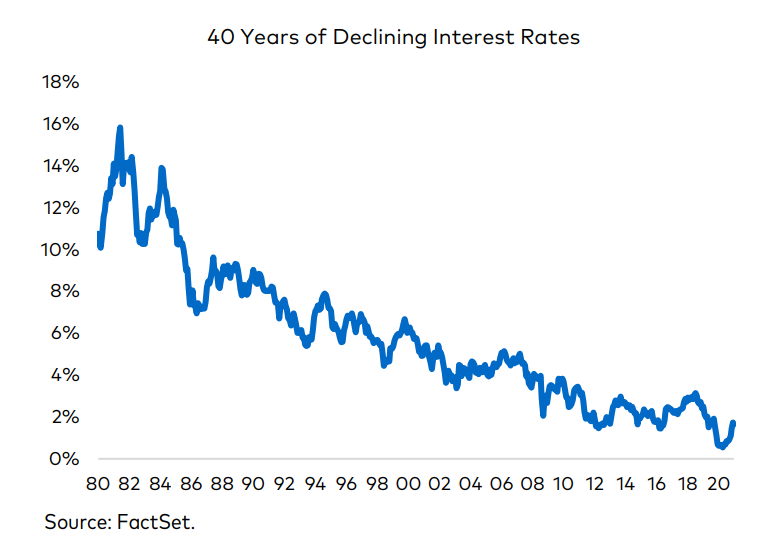
Throughout its history, and that of most of its peers, the Polen Focus Growth Fund has never been through a genuinely inflationary period. Interest rates have trended mostly downward for the past 40 years, with US ten-year bonds enjoying an enormous once in a lifetime rally, declining from 16 per cent to a low of 0.5 per cent, recorded in mid-2020. The current US ten-year bond yield is 1.75 per cent.
Higher interest rates would likely put downward pressure on price-to-earnings (P/E) multiples, even in the absence of high inflation. As noted here, the dynamics of higher inflation could remain in place for some time as global supply chains and labour markets work to readjust to increased demand after severe dislocations stemming from COVID-19. Over the medium-term however, inflation will have to compete against a number of structural deflationary forces including aging demographics, globalisation, automation and digitisation.
For companies with higher valuations, we need to believe earnings growth estimates support at least double-digit average annual returns, even if there is some compression of the P/E multiple over time due to the potential of higher interest rates.
The best way to offset P/E multiple compression is through investing in companies that can deliver continuous and sustained earnings growth to the Portfolio. And to achieve this, the Portfolio must be packed with businesses that have a unique value proposition, a strong competitive advantage and a deep desire to deliver results for all key stakeholders.
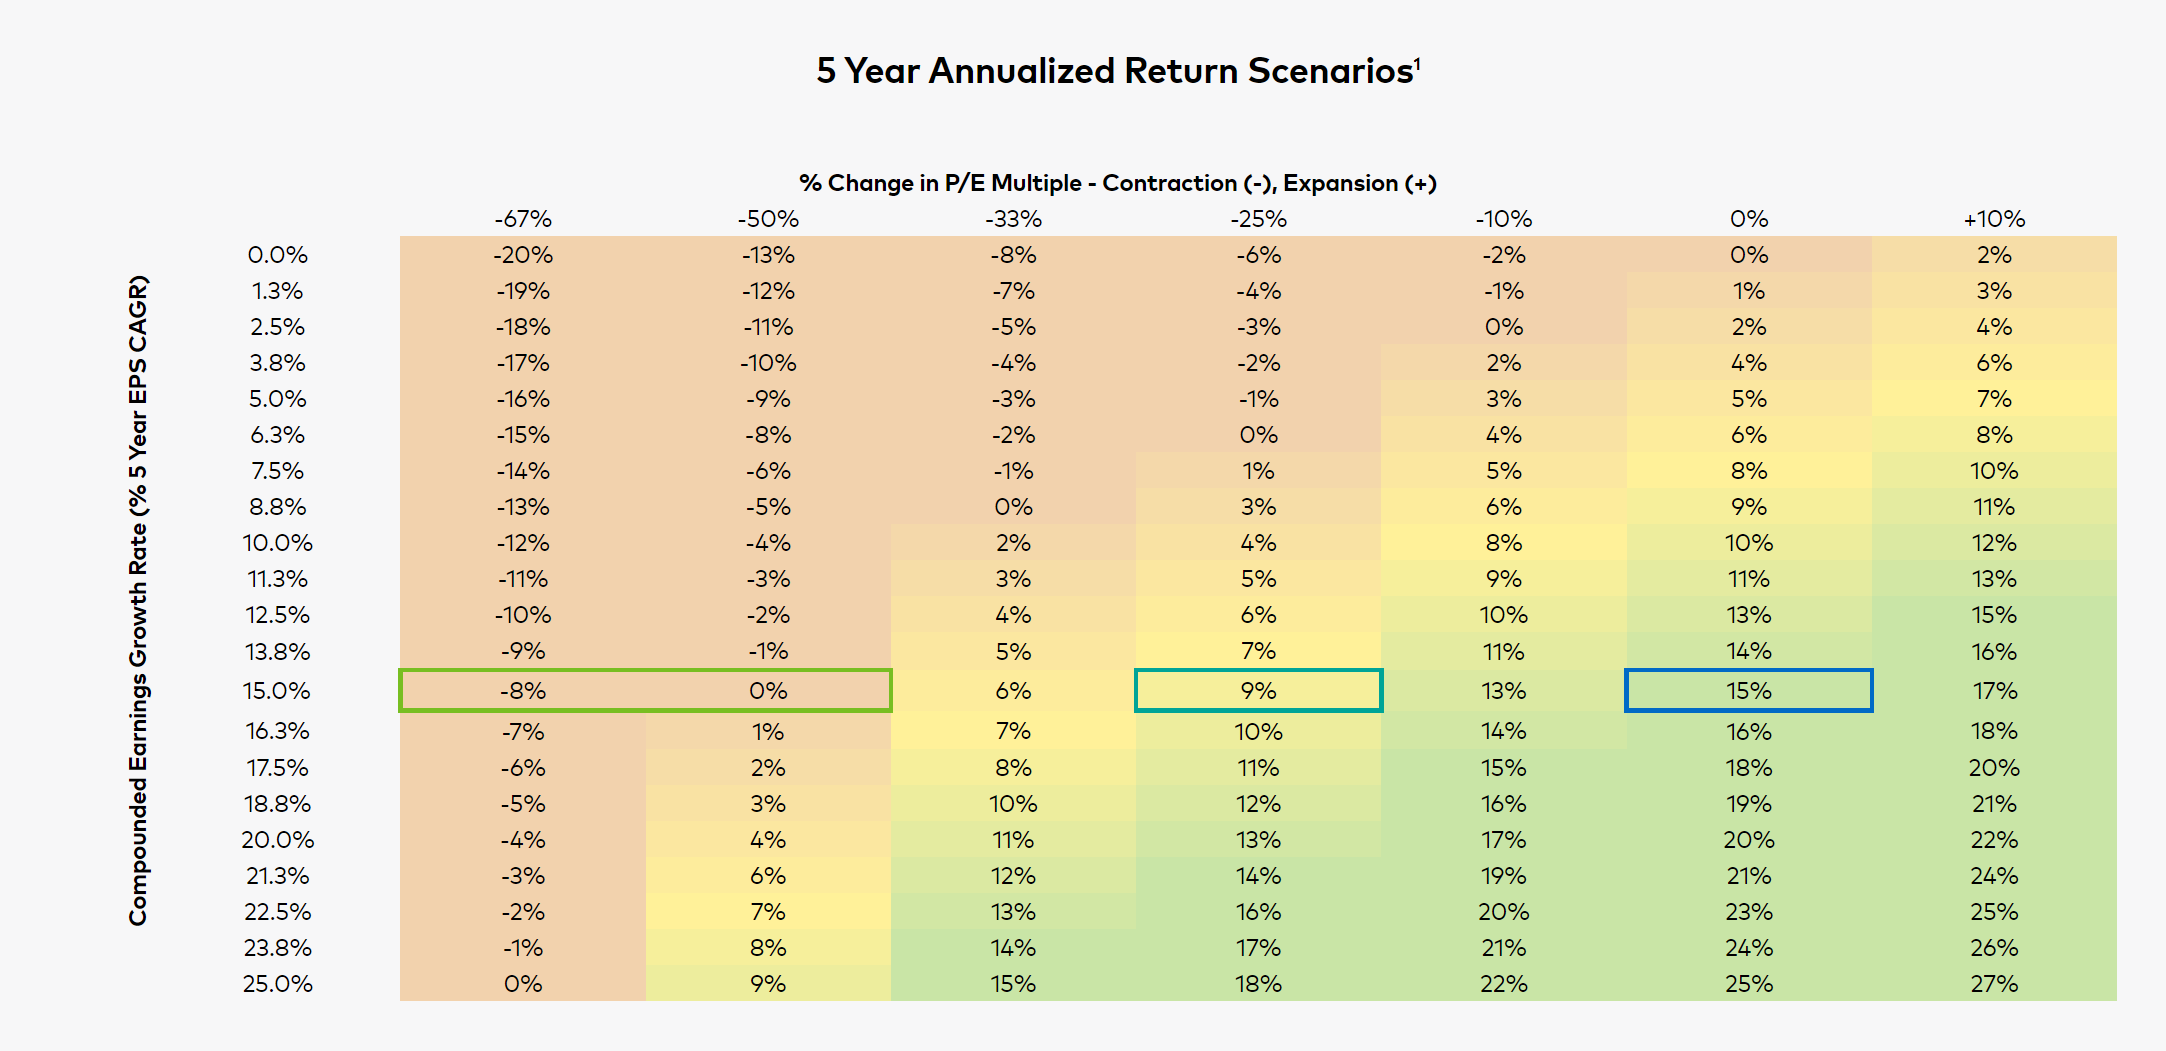
The heat map below analyses Degrees of Expected Returns, where the y-axis depicts the compounded annualised EPS growth over 5 years (from 0 per cent to 25 per cent) and the x-axis represents the change in the P/E multiple over 5 years (from negative 67 per cent to positive 10 per cent).
The example, ABC Company, is growing its EPS at 15 per cent per annum. If there is no change to the P/E multiple, then its five-year return is 15 per cent per annum. However, if there is a linear 25 per cent P/E compression, its five-year return declines to 9 per cent per annum. Furthermore, the P/E multiple would need to compress by more than 50 per cent for ABC Company to deliver a negative return.
According to research by Polen Capital, based on the Portfolio’s elevated expected earnings growth over the medium term (say 5 years), the Fund could withstand a compression in the Portfolio’s P/E multiple of approximately one-third, and still deliver double-digit annualised returns. And based on the Heat Map, those companies that deliver annualised EPS growth of 20 per cent over five years while also experiencing a linear one-third P/E compression should still achieve an annualised 11 per cent return.
To enlarge the chart, click on the image.
Source: Polen Capital